

In a data sensitive application debugging is the most critical and time consuming especially if requests traffic is tremendously high, when it comes to debugging every developer’s last resort is application logs and debugging in large logs file is not an easy task.
In this post I will brief you about how we can make rails logs searchable, Using Filebeat and Elastic Stack for making debugging fast and easy via UI enabled log search. Wait…, Filebeat is not a separate entity it falls under an elastic stack only which is a lightweight log shipper which will not hoard your resources.
This post will cover following
- Brief intro to Elastic Stack
- Filebeat configuration and setup
- Custom Index Template with rollover for application logs
- Lograge setup to output logs into JSON format
- Demo Rails application refer this repository
Brief about Elastic Stack
Elastic stack comprises of Elasticsearch, Kibana, Beats, and Logstash formerly known as the ELK Stack which is used to monitor, visualize, search and analyse the applications data in realtime and Filebeat is a lightweight data shipper belonging to the Beats family which is mainly used to ship data from files.
Filebeat setup and configuration
Installation
Installation of filebeat is dead simple. You can follow simple steps described in official documentation.
Sample filebeat.yml – /usr/local/etc/filebeat/filebeat.yml
#---------- Filebeat inputs ----------
filebeat.inputs:
- type: log
  enabled: true
  json:
    message_key: message
    keys_under_root: true
    overwrite_keys: true
  paths:
    - /Users/pramod/projects/efk-rails/log/sync_development.log
#ElasticSearch template setting
setup.ilm.enabled: false
setup.template.enabled: false
setup.template.name: "efk-rails-sync-dev"
setup.template.pattern: "efk-rails-sync-dev-*"
#---------- Kibana ----------
setup.kibana:
  host: "0.0.0.0:5601"
#---------- Elasticsearch output ----------
output.elasticsearch:
  # Array of hosts to connect to.
  hosts: ["0.0.0.0:9200"]
  index: "sync-log-dev"
In above configuration file we have configured following options
- inputs – Used for specifying input for filebeat, here we have configured input as rails log file
/Users/pramod/projects/efk-rails/log/sync_development.logwith JSON option which will decode logs structured as JSON messages - output – Used to set the output for filebeat, here we will write to elasticsearch indexes.
- setup.kibana – the Kibana endpoint which will load the kibana dashboard
Custom Index Template with rollover
We off course can use the default template and rollover options but you cannot use the custom index template names, this is specially needed if you want the setup environment wise kibana dashboards on a single kibana and elasticsearch instances and this is what we needed in most of the Rails applications.
Here we will use the custom template and index lifecycle management (ilm) for rotating our logs indexes as per different rails environments.
To enable a custom index template name and rollover policy you need to follow the following steps
- Setup a ilm enabled to false, add custom template name and pattern with following options
setup.ilm.enabled: false
setup.template.enabled: false
setup.template.name: "efk-rails-sync-dev"
setup.template.pattern: "efk-rails-sync-dev-*"
Above config will tell filebeat to use efk-rails-sync-dev and efk-rails-sync-dev-* name and index pattern respectively, It’s a common practice to specify the index pattern rather than using index name.
2. Create a life cycle policy using Kibana dev tool
PUT _ilm/policy/sync-log
{
  "policy": {
    "phases": {
      "hot": {
        "min_age": "0ms",
        "actions": {
          "rollover": {
            "max_age": "3d",
            "max_size": "100mb"
          }
        }
      },
      "delete": {
        "min_age": "2d",
        "actions": {
          "delete": {}
        }
      }
    }
  }
}
Above will create a index lifecycle policy which will rollover indexes if its size reaches to 100mb or index age is 3 days whichever turns first true.
3. Create template pattern using Kibana dev tool
PUT _template/efk-rails-sync-dev
{
  "index_patterns": ["efk-rails-sync-dev-*"],
  "settings": {
    "number_of_shards": 1,
    "index.lifecycle.name": "sync-log",
    "index.lifecycle.rollover_alias": "sync-log-dev"
  }
}
This will create a template efk-rails-sync-dev with index alias sync-log-dev and attach lifecycle policy sync-logthat created in step 2.
4. In last step we will create the first index managed by a policy that uses the rollover action and designate it as the write index
PUT efk-rails-sync-dev-000001
{
  "aliases": {
    "sync-log-dev":{
      "is_write_index": true
    }
  }
}
This will create initial index efk-rails-sync-dev-000001 which will be used by filebeat to write output of application.
Application logs in JSON format
Once you create index life cycle policy, template and first rollover index which will capture logs from filebeat harvester. You need make your application logs to output in JSON format.
To output rails logs into JSON format, we are using lograge gem once you add it in Gemfile and bundle install it will be available to use in you application.
For demo purpose, We will be logging only single controller actions into JSON and search via Kibana.
Following lograge configuration will output logs in JSON for SyncContoller#index and SyncController#Create action
$config/initializers/lograge.rb
Rails.application.configure do
  config.lograge.enabled = true
  config.lograge.keep_original_rails_log = true
  config.lograge.base_controller_class = 'ActionController::API'
  config.lograge.logger = ActiveSupport::Logger.new "#{Rails.root}/log/sync_#{Rails.env}.log"
  config.lograge.formatter = Lograge::Formatters::Json.new
  config.lograge.ignore_custom = lambda do |event|
    # return true here if you want to ignore based on the event
    return false if event.payload[:controller].include?("SyncController") &&
     ['index', 'create'].include?(event.payload[:action])
    return true
  end
  config.lograge.custom_payload do |controller|
    if controller.class.name.include?('SyncController')
      SyncLogger.new(controller).log_data
    end
  end
end
SyncLogger service to add some meta data to logger file
$app/services/sync_logger.rb
class SyncLogger
  def initialize(controller)
    @controller = controller
  end
  def log_data
    request_type = @controller.request.method
    username = @controller.current_user.try(:username) || 'guest'
    r_data = request_type == 'GET' ? JSON.parse(@controller.response.body) : @controller.request.parameters
    log_data = {
      u_agent: @controller.request.user_agent,
      request_time: Time.now.to_s(:number),
      search_key: "#{request_type}_#{username}_#{Time.zone.now.to_s(:number)}",
      ip: @controller.request.ip,
      user_id: @controller.current_user.try(:id),
      username: username,
      data: r_data
    }
  end
end
Above service will create JSON output for SyncContoller#index and SyncController#Create action in following format
$log/sync_development.log
{"method":"GET","path":"/sync","format":"*/*","controller":"SyncController","action":"index","status":200,"duration":16.64,"view":1.18,"db":0.2,"u_agent":"PostmanRuntime/7.26.1","request_time":"20200818210529","search_key":"GET_pramod_20200818153529","ip":"127.0.0.1","user_id":1,"username":"pramod","data":[{"username":"pramod"},{"username":"pramdo1"}]}
{"method":"GET","path":"/sync","format":"*/*","controller":"SyncController","action":"index","status":200,"duration":15.82,"view":0.48,"db":0.93,"u_agent":"PostmanRuntime/7.26.1","request_time":"20200818210647","search_key":"GET_pramod_20200818153647","ip":"127.0.0.1","user_id":1,"username":"pramod","data":[{"username":"pramod"},{"username":"pramdo1"}]}
Starting filebeat to ship above logs to elasticsearch by executing following command from the root of the filebeat if you have downloaded the tar and extracted it or if you have installed filebeat as a service you can start filebeat as a service
./filebeat -e
or
sudo service filebeat start
You should see following filebeat logs on successful
INFO	registrar/registrar.go:152	States Loaded from registrar: 2
2020-08-18T21:46:30.722+0530	INFO	crawler/crawler.go:72	Loading Inputs: 1
2020-08-18T21:46:30.723+0530	INFO	log/input.go:152	Configured paths: [/Users/pramod/projects/efk-rails/log/sync_development.log]
2020-08-18T21:46:30.723+0530	INFO	input/input.go:114	Starting input of type: log; ID: 15918551478222648142
2020-08-18T21:46:30.723+0530	INFO	crawler/crawler.go:106	Loading and starting Inputs completed. Enabled inputs: 1
Kibana in Action
If above all is set correctly, We can search logs via Kibana by creating index pattern. You should see `efk-rails-sync-dev-000001` index in kibana index management, Using same index you can create index pattern for search.
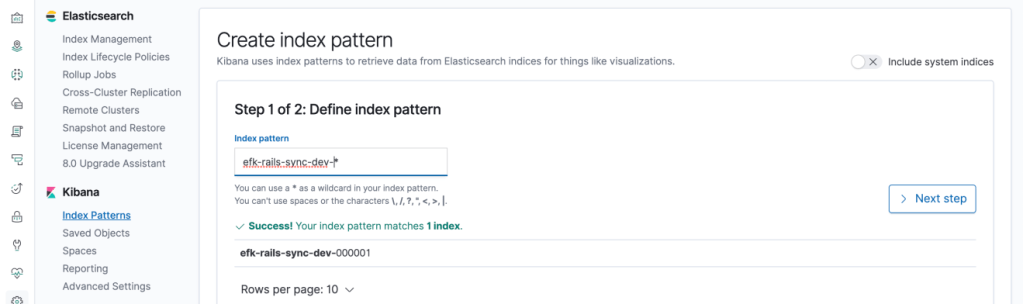
Kibana Index Pattern
Searching via Kiabana Discover

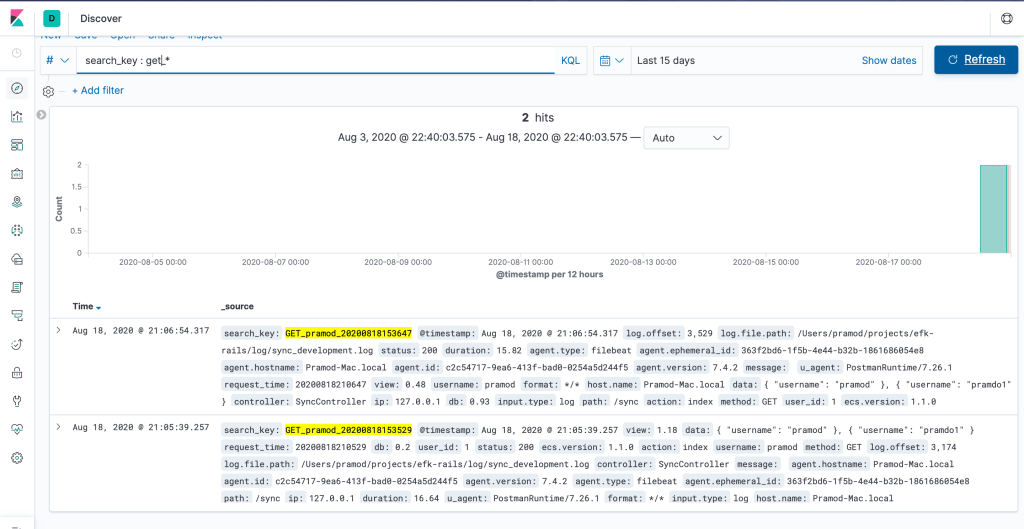

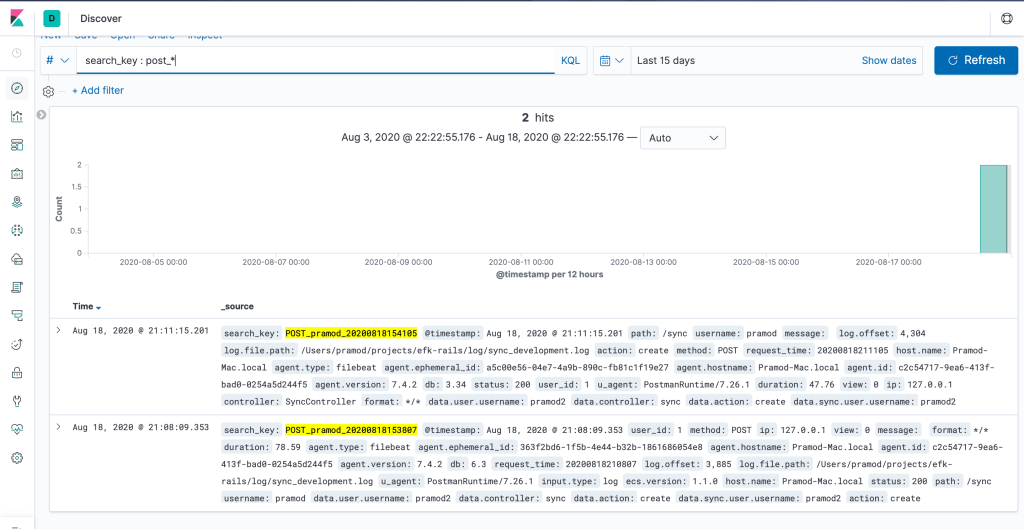

Yes, We are done! if you follow above mentioned steps you should be able to do similar setup in your application. If you have any doubts or suggestions let me know in comment section.
Summary:
Using multiple databases in your application used to involve quite a bit of extra work, or extra libraries. However, now it’s quite simple and easy to use. While your use case will likely differ from ours, being able to independently scale your databases by splitting model data across multiple locations can have extra benefits, thanks to the Active Record for being more highly accessible than ever.
